
Support

|

|

|

|
Monitor system activity
|
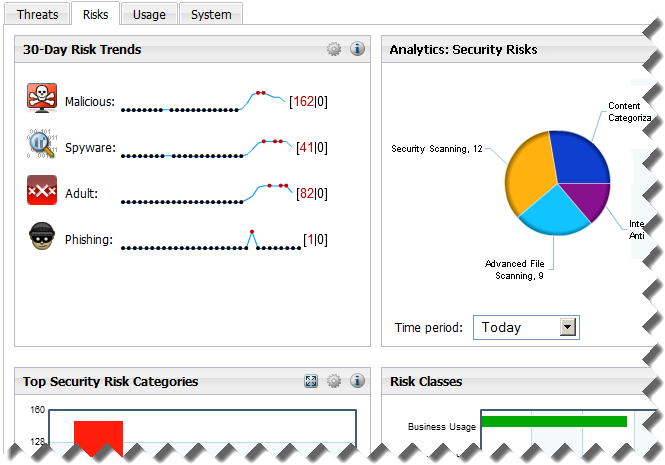
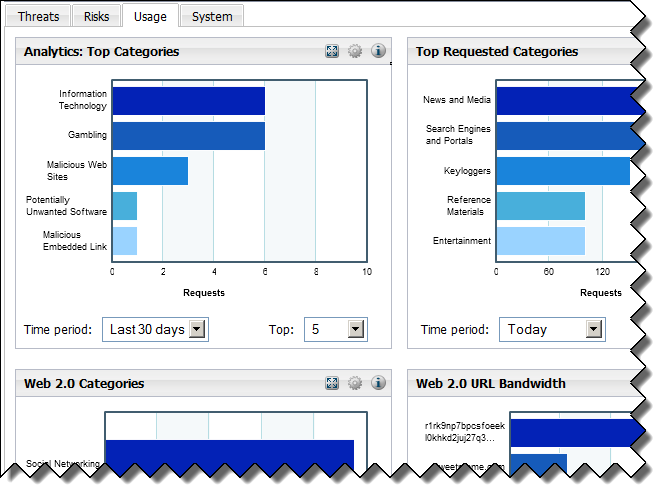
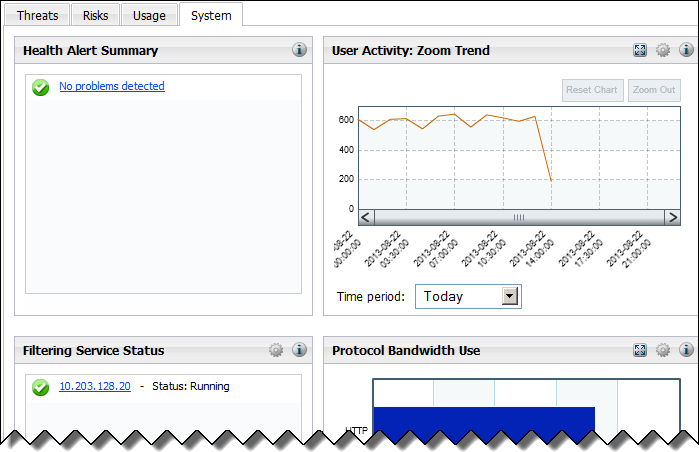
In addition to the Threats dashboard, the Status > Dashboard page includes dashboards that show:
|
|
Risks (including security risks, sorting of traffic into non-security risk classes, and uncategorized requests)
|
|
|
Usage patterns (including top categories and summaries of analytic activity)
|
|
|
System statistics (including a summary of active health alerts and a trend chart showing volume of monitoring activity)
|
 Quick Links
 Service Requests
How are we doing?
Provide us feedback on your experience with the Service Request portal.
provide feedback >|
|
|
|
|
Monitor system activity
|