Analytics
The Analytics tab provides a set of monitoring pages that show a snapshot of service activity over time.
Note: Monitoring pages will be made available for each policy stage in future releases.
- 1
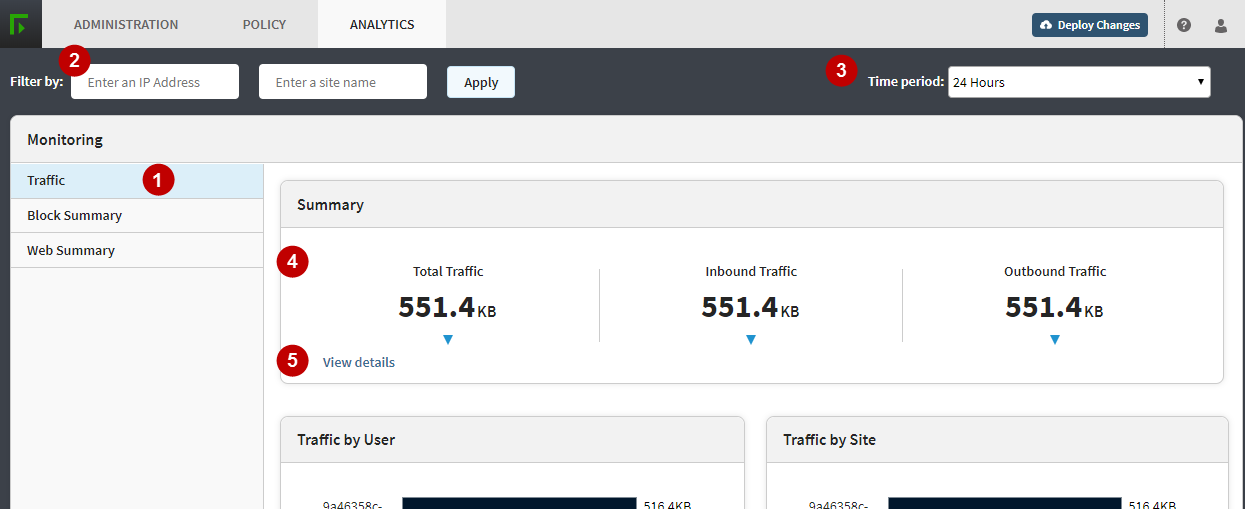
- Monitoring tabs: select a tab to open the summary monitoring screen.
- 2
- Time period: select an item from the drop-down menu to update all panels on the page for the selected time period. By default, 24 hours is displayed.
- 3
- Report filters: enter your filter and click Apply. All panels are updated to display only data relevant to your filter. To clear your filters, click Clear
All and Apply. Note: Currently, you can filter monitoring information by IP address or Site name.
- 4
- Report panels: each report tab has a set of panels that display detailed summary information. Click View more to see more detailed information.
- 5
- View details: click to view detailed transaction information for the report, where available.