Go to the table of contents Go to the previous page Go to the next page View or print as PDF
Navigation Tips > Lesson 1: Using TRITON - Web Security
Lesson 1: Using TRITON - Web Security
New User Quick Start | Web Security Solutions | Version 7.7.x
The TRITON Unified Security Center (TRITON console) is the interface to the configuration, administration, and reporting functions of your Websense software. An administrator can be granted access to one or more TRITON console modules (Web Security, Data Security, and Email Security), and given specific permissions within each module.
The default administrative account for the TRITON console is admin. The initial password for this account is set during installation. The admin account has full access to all TRITON modules. In the Web Security module, full access is equivalent to unconditional Super Administrator permissions.
If you are logged on as a delegated administrator with more limited permissions, some features (indicated below) may not be visible.
The Web Security module of the TRITON console (TRITON - Web Security) is divided into 4 main areas:
*
The TRITON banner shows information about your logon session.
*
The TRITON toolbar makes it easy to switch between modules, access TRITON settings, launch Appliance Manager for any registered V-Series appliances, and get Help.
*
The Web Security toolbar lets you switch between Policy Servers, change administrative roles, and review and save changes.
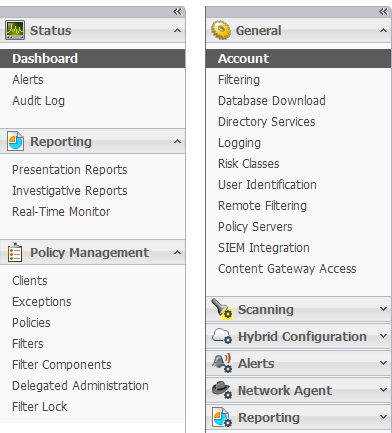
The left navigation pane is used to access status, reporting, and policy management features (Main tab), as well as system administration tasks (Settings tab).
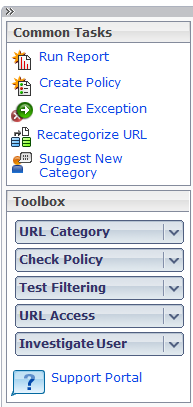
The right shortcut pane is used to jump to common administrative tasks and access quick lookup tools.
The content pane appears in the center of the TRITON console. The selections that you make in the left navigation pane or right shortcut pane determine what appears in the content pane.
Section 1: The banner, TRITON toolbar, and Web Security toolbar:
The TRITON - Web Security features that you see when you log on are dependent on your administrative role. The banner displays the user name for the account used to log on. If your organization does not use delegated administration, the account name is always admin, and has full access to all TRITON - Web Security functions.
The banner also includes a Log Off button, for when you're ready to end the session.
Just below the banner, the TRITON toolbar contains a tab for each TRITON console module. The current module is highlighted in yellow, and other available modules are shown in blue. Unavailable modules appear in gray. The TRITON toolbar also includes the following buttons:
*
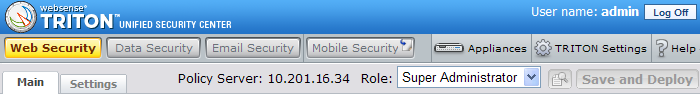
Appliances, used to launch Appliance Manager for any V-Series appliances associated with the current Policy Server.
*
TRITON Settings, used to perform configuration tasks that affect all of the installed TRITON modules, like creating administrator accounts.
*
Help, used to access context-sensitive instructions and troubleshooting materials, tutorials, and online Support tools. More information is available in Lesson 2: Accessing Help.
Under the module tray, the Web Security toolbar provides information and access to features that apply to all pages in TRITON - Web Security:
*
The current Policy Server IP address.
When you log on to TRITON - Web Security, you connect to a Websense software component called Policy Server. By connecting to a specific Policy Server, you determine which segment of your Websense software deployment to manage.
*
When delegated administration roles are defined, administrators who manage multiple roles can use this list to change between roles. Super Administrators can use the list to switch to any role that has been defined.
*
A View Pending Changes button that is enabled when changes have been cached, but not changed.
Use this button to review a summary of cached changes before saving them, or to discard all pending changes.
*
A Save and Deploy button, whose color indicates whether there are cached changes waiting to be saved
Each time you perform a task in TRITON - Web Security, and then click OK, your changes are cached. You must click Save and Deploy to save and implement the changes.
Section 2: The left navigation pane:
The left navigation pane has 2 tabs: Main (shown on the left in the image below) and Settings (on the right).
*
The Main tab provides access to system status information, reporting functions, and policy configuration and management tools. It is available to all administrative users, but some navigation links are hidden for conditional Super Administrators and delegated administrators.
*
The Settings tab provides access to Websense account management functions, as well as global and local system administration tasks. It is hidden from some administrators, and shows different options based on the current administrator's permissions.
To minimize the left navigation pane, expanding the amount of space available for the content pane, click the double left arrow icon (<<) above the Status group. When the left navigation pane is minimized, it displays a small icon for each section of the current tab. Hover the mouse over an icon to display a menu of features in that group.
Section 3: The right shortcut pane:
For the default admin account and unconditional Super Administrators, the right shortcut pane includes all options in the sections described below. Some options are hidden for other administrators.
*
Common Tasks provides shortcuts to frequently-performed administrative tasks.
*
Click Run Report to jump to the Presentation Reports page, and then browse the report catalog to start creating a report.
*
Click Create Policy to jump to the Policies page, and then click Add to create a policy.
*
Click Create Exception to jump to the Exceptions > Add Exception page to permit or block one or more URLs for all clients (global exception), all clients in a delegated administration role, or one or more individual clients.
*
Click Recategorize URL to jump to the Filter Components > Edit Categories page, and then select a new category for the URL that you want to recategorize.
*
Click Suggest New Category to open the MyWebsense portal. When you log on to MyWebsense, you are taken to the Site Lookup tool. First identify the site's current category, and then suggest a new category.
*
The Toolbox contains quick lookup tools that you can use to verify your filtering setup.
*
Click URL Category to quickly determine how a URL is categorized.
*
Click Check Policy to find out which policy is currently being applied to a user.
*
Click Test Filtering to see how a specific URL is currently being filtered (permitted, blocked, etc.) for a user.
*
Click URL Access to create an investigative report showing whether a site has been accessed from your network within the past 14 days.
*
Click Investigate User to create an investigative report showing which sites a user has visited in the past 14 days.
Section 4: The content pane:
The content pane appears in the middle of the TRITON Unified Security Center. When you first open TRITON - Web Security, the Web Security Dashboard appears in the content pane, showing information about advanced malware threat activity detected in your network.
When you click a link in the left navigation pane or the right shortcut pane, the content pane changes to display options appropriate to your selection. Most pages on which you can make changes include an OK and a Cancel button. Click OK to cache all changes on the page, or click Cancel to abandon all changes on the page. To save cached changes, click Save and Deploy in the Web Security toolbar.
Important 
Most of the remaining lessons in this Quick Start demonstrate how to use options in the content pane.
Continue with Lesson 2: Accessing Help.

Go to the table of contents Go to the previous page Go to the next page View or print as PDF
Navigation Tips > Lesson 1: Using TRITON - Web Security
Copyright 2016 Forcepoint LLC. All rights reserved.