
|

|

|

|
|
|
?
|
|
?
|
Click Edit next to the item you want to change.
|
|
?
|
Make required changes and click OK on the edited page to return to the Confirmation page.
|
|

|
In the field Route name, enter a name for your route.
|
|

|
In the field Protected Domain Name, designate a protected domain.
|
|

|
To enable email routing to use Transport Layer Security (TLS) to encrypt the transmission, mark the check box Use Transport Layer Security.
|
|

|
To force a user to enter username and password credentials, mark the check box Require Authentication.
|
|

|
|

|
|
ï¡ï€®ï€ˆ
|
Navigate to Settings > Inbound/Outbound > Mail Routing.
|
|
ï¢ï€®ï€ˆ
|
|
ï£ï€®ï€ˆ
|
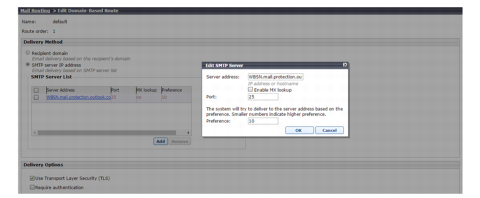
From Delivery Method, select SMTP server IP address.
|
|
ï¤ï€®ï€ˆ
|
|
?
|
In the Office 365 Admin Center, select Settings > Domains.
|
|
ï¦ï€®ï€ˆ
|
For Port, enter 25.
|
|
ï§ï€®ï€ˆ
|
|
ï¨ï€®ï€ˆ
|
Click OK.
|
|
ï©ï€®ï€ˆ
|
Under Delivery Options, select Use Transport Layer Security (TLS).
|
|
ïªï€®ï€ˆ
|
Click OK.
|
|

|
Specify an email address to which system notification messages should be sent. This is typically an administrator address. See Setting system notification email addresses.
|
|

|
In the Email module, data loss prevention policies are enabled by default. To manage DLP policies, navigate to Main > Policy Management > DLP Policies > Manage Policies.
|
|

|
|

|
|

|
|

|
Click Deploy. No other configuration steps are required.
|
|

|
Navigate to the page Settings > General > Subscription.
|
|

|
In the field Subscription key, enter the subscription key.
|
|

|
Click OK.
|
|

|
|

|
(If your subscription key includes Forcepoint Email Security Hybrid Module) Navigate to the page Settings > Hybrid Service > Hybrid Configuration.
|
|
?
|
|

|
|

|
|

|
|

|
|
?
|
From the Security Manager banner, click the icon Appliances.
|
|
?
|
From the Security Manager banner, click the icon Global Settings.
|
|

|
|

|
Click Explain This page.
|
|

|
|

|
|
?
|
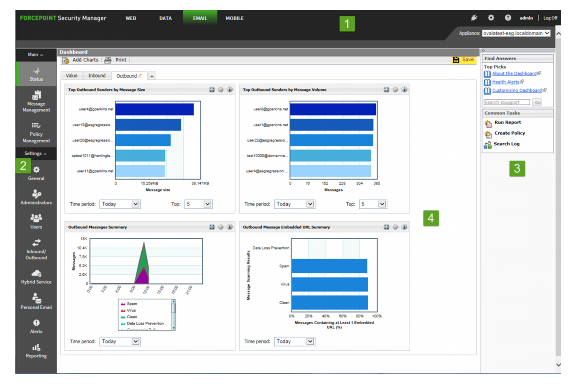
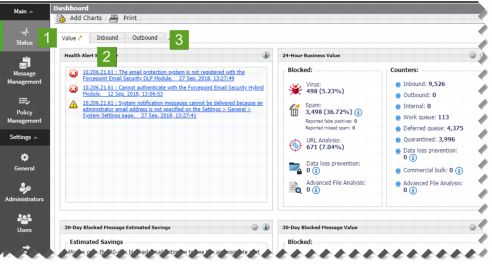
The Value dashboard tab (1) displays on first login and shows information about the value of Forcepoint Email Security in the network, along with a summary of system health alerts.
|
|
?
|
The Inbound dashboard tab (2) shows graphical charts that display top domains and message recipients for inbound email. Top domain and recipient information is sorted by message size or volume.
|
|
?
|
The Outbound dashboard tab (3) shows graphical charts that display top senders for outbound email, sorted by message size or volume. Other default charts for this tab show an overall outbound message summary and a summary of outbound messages that contained embedded URLs.
|
|
|
Selection displays the Add Charts page to add elements to the Value, Inbound, Outbound, or any custom dashboard tab. See Adding elements to a dashboard tab.
|
|
|
|
||
|
|
|
?
|
From the dashboard, click Add Charts.
|
|

|
|

|
|

|
|

|
|

|
Click Remove.
|
|

|
Click Remove.
|
|

|
|

|
|

|
Click Print.
|
|

|
Click Print.
|
|

|
|

|
Click Edit.
|
|
?
|
|
?
|
|
?
|
|
?
|
"Top" numerical designation (e.g., Top N Data Loss Prevention Violations)
|
|
?
|
Copy chart (adds chart to the active tab with "(2)" at the end of the title; select Edit to change the chart name)
|
|

|
Click OK.
|
|

|
|

|
|

|
|

|
When finished, click Close.
|
|
?
|
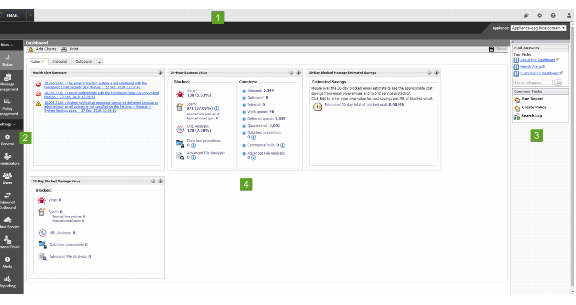
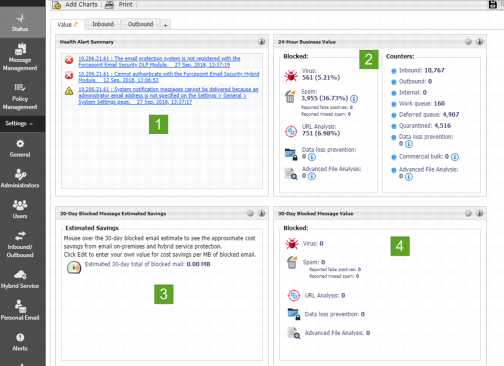
The Health Alert Summary (1) shows the status of your Forcepoint software. Selection of an error or warning alert message to open the Alerts page, where more detailed alert information is available (see Viewing system alerts).
|
|
?
|
The 24-Hour Business Value chart (2) displays statistics showing how your email security software has protected your network during the past 24 hours by blocking suspicious email traffic. Data includes total numbers of blocked connections and messages listed by analysis result, the numbers of false positive and missed spam results from email analysis, and the number totals for various types of messages handled by the email system.
|
|
?
|
The 30-Day Blocked Message Estimated Savings chart (3) provides an estimate of savings afforded by your email protection system, which can stop unwanted mail and threats (including at the connection level), protect network resources, and save an organization time and money. With the addition of the Forcepoint Email Security Hybrid Module, infected traffic is stopped before it enters the network, increasing the savings.
|
|
?
|
The 30-Day Blocked Message Value chart (4) displays metrics similar to the 24-hour value chart demonstrating email system protection for the previous 30 days. This chart illustrates the total numbers and percentages of blocked connections and messages, including false positive and missed spam results from email analysis.
|
|

|
|

|
In the field Tab name, enter the new name for the Value tab.
|
|

|
Click OK.
|
|
?
|
From the dashboard, click Add Charts.
|
|

|
|

|
Click Remove.
|
|

|
Click Remove.
|
|

|
|
?
|
The Top Inbound Domains by Message Size chart displays the message domains that are the source of the majority of inbound messages, plotted by message size.
|
|
?
|
The Top Inbound Domains by Message Volume chart shows the message domains that account for the majority of all inbound messages.
|
|
?
|
The Top Inbound Recipients by Message Size chart displays the recipient addresses that receive the majority of inbound email, plotted by message size.
|
|
?
|
The Top Inbound Recipients by Message Volume chart shows the recipient addresses that receive the majority of all inbound email.
|
|

|
|

|
In the field Tab name, enter the new name for the Inbound tab.
|
|

|
Click OK.
|
|
?
|
From the dashboard, click Add Charts.
|
|

|
|

|
Click Remove.
|
|

|
Click Remove.
|
|

|
|
?
|
The Top Outbound Senders by Message Size chart displays the sender addresses that account for the majority of outbound email, plotted by message size.
|
|
?
|
The Top Outbound Senders by Message Volume chart shows the sender addresses that represent the majority of all outbound messages.
|
|
?
|
The Outbound Messages Summary chart displays the total number of outbound messages processed by your email protection software, sorted by message analysis result (clean, virus, spam, and so on).
|
|
?
|
The Outbound Message Embedded URL Summary chart shows the percentage of analyzed outbound messages that contain at least one embedded URL, displayed by message analysis result. For example, if 50 outbound messages are determined to be spam, and 40 of those messages contain an embedded URL, then the percentage shown in this chart for the spam message type is 80% (40/50).
|
|

|
|

|
In the field Tab name, enter the new name for the Outbound tab.
|
|

|
Click OK.
|
|
?
|
From the dashboard, click Add Charts.
|
|

|
|

|
Click Remove.
|
|

|
Click Remove.
|
|

|
|
See Available dashboard charts for a complete list of available elements.
|
|
|

|
In the section Available Tabs, from the pull-down menu Add elements to tab, select the desired dashboard tab.
|
|

|
(Optional) If a default tab is selected (i.e., Value, Inbound, or Outbound), click Restore Tab Defaults.
|
|

|
|
?
|
Chart type: Many charts can be displayed as a multi-series bar, column, or line chart, or as a stacked area or column chart. Some can be displayed as bar, column, line, or pie charts. The types available depend on the data being displayed.
|
|
?
|
Time period: Most charts can display a variable time period: Today (the period since midnight of the current day), the last 7 days, or last 30 days.
|
|
?
|
Top: Charts displaying information about the top users, categories, URLs, and so on can display up to 5 values. Select whether to show the top five values, 6-10 values, 11-15 values, or 16-20 values.
|
|

|
|

|
|
?
|
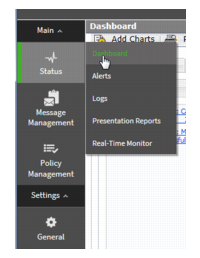
From the left navigation pane, select Status > Alerts.
|
|
?
|
|
?
|
From Active Alerts, click What is monitored?
|
|
?
|
|
?
|
From an informational alert, click Learn More.
|
|
?
|
|
?
|
|
?
|
|
?
|
|
?
|
|
?
|
|
|||||||||||||||||||||||||||||||||||||||||||||||||||||||||||||||
|
|||||||||||||||||||||||||||||||||||||||||||||||||||||||||||||||
|
|

|
|

|
From the pull-down menu Filter, select a message element on which to search.
|
|

|
From the pull-down menu Condition, select a filter condition on which to search.
|
|

|
In the field Value, enter a keyword on the filter and condition.
|
|

|
To add more search filters, click the plus sign.
|
|

|
|

|
To add more search options, click Advanced Options.
|
|

|
Click Search.
|
|

|
|

|
|

|
|

|
From the Message Log, click Export.
|
|

|
|
?
|
|

|
|

|
Click OK.
|
|
Indicator of whether message is quarantined (Yes or No). A View link appears for a message isolated by a DLP or advanced file analysis policy.
|
|

|
|

|
|

|
|

|
From the Message Details page, click an option for the message; Deliver, Delete, Reprocess, Not Spam, or an available option from the pull-down menu More Actions.
|
|

|
|
?
|
|

|
From the Message Log, click the subject of a message.
|
|

|
From the Log Details page, click View Log Details.
|
|

|
|
Possible Blocked status details are as follows:
Possible Accepted status details are as follows:
|
|
?
|
|

|
|

|
From the pull-down menu Keyword search, select a Connection Log element in which to search; All, Sender IP address, Security level, or Connection status.
|
|

|
|

|
Click Search.
|
|

|
|

|
|

|
|

|
From the Connection Log, click Export.
|
|

|
|
?
|
Selection of CSV enables data to be opened or saved as a text file in comma-separated value format.
|
|
?
|
Selection of HTML enables data to be opened or saved as an HTML file.
|
|

|
From Page range, indicate the pages to export; All, Current Page, or Pages.
|
|

|
Click OK.
|
|
?
|
|

|
From the pull-down menu View, select the range of log entries to display; All, One Day, One Week, One Month, or Custom.
|
|

|
|

|
(If Custom was selected) Enter the desired date and time range in the fields, or use the calendar functionality.
|
|

|
|

|
|

|
|

|
From the pull-down menu Export range, select a time period; Current page, Last 24 hours, Last 7 days, or Last 30 days.
|
|

|
|
?
|
|

|
Click OK.
|
|
?
|
|

|
From the pull-down menu View, select the range of log entries to display; All, One Day, One Week, One Month, or Custom.
|
|

|
|

|
(If Custom was selected) Enter the desired date and time range in the fields, or use the calendar functionality.
|
|

|
From the pull-down menu Keyword search, select a Personal Email Manager Audit Log element in which to search; Message ID or User Name.
|
|

|
|

|
From the pull-down menu Appliance, select the appliance on which to perform the search.
|
|

|
Click Search.
|
|

|
|

|
|

|
From the pull-down menu Export range, select a time period; Current page, Last 24 hours, Last 7 days, or Last 30 days.
|
|

|
|
?
|
|

|
Click OK.
|
|
?
|
|

|
From the pull-down menu View, select the range of log entries to display; All, One Day, One Week, One Month, or Custom.
|
|

|
|

|
(If Custom was selected) Enter the desired date and time range in the fields, or use the calendar functionality.
|
|

|
From the pull-down menu View by type, select the type of system events to display.
|
|

|
|

|
|

|
|

|
From the pull-down menu Export range, select a time period; Current page, Last 24 hours, Last 7 days, or Last 30 days.
|
|

|
|
?
|
|

|
Click OK.
|
|
?
|
|

|
From the pull-down menu View, select the range of log entries to display; All, One Day, One Week, One Month, or Custom.
|
|

|
|

|
(If Custom was selected) Enter the desired date and time range in the fields, or use the calendar functionality.
|
|

|
|

|
|

|
|

|
From the pull-down menu Export range, select a time period; Current page, Last 24 hours, Last 7 days, or Last 30 days.
|
|

|
|
?
|
|

|
Click OK.
|
|
?
|
|

|
From the pull-down menu Keyword search, select a Email Hybrid Service Log element in which to search; Email Hybrid Service Log ID, Subject, Sender Address, Recipient Address, Sender IP, or Message Status.
|
|

|
|

|
Click Search.
|
|

|
|

|
|

|
|

|
|

|
|
?
|
|

|
|

|
Click OK.
|
|
|
|||||
|
|
|||||
|
|||||
|

|
|

|
From Display log entries for, click the check boxes for one or multiple types of log entries to display; Message status, Connection status, Message delivery status, or Message analysis result.
|
|

|
|

|
|

|
In the field Search filter, enter keywords on which to search.
|
|

|
|

|
|

|
|

|
From Appliance, click Select.
|
|

|
|

|
On the page SIEM Integration, mark the check box Enable SIEM integration for all email appliances.
|
|

|
In the entry field IP address or hostname, enter the IP address or hostname for the SIEM integration server.
|
|

|
In the entry field Port, enter the port number for the SIEM integration server.
|
|

|
|

|
From the pull-down menu SIEM format, select the format to be used in SIEM logs.
|
|

|
|

|
|

|
|

|
|

|
|

|
|

|
|
|
?
|
This email address is not used to send marketing, sales, or other, general information.
|
|

|
|

|
Enter a Delivery route name.
|
|

|
Enter the Domain Address (for example, mydomain.com).
|
|

|
|
Protected domains added here must already be entered in the Protected Domain group on the page Settings > Users > Domain Groups. See Managing domain and IP address groups.
|
|

|
|

|
|

|
(Optional) Change the preference order; check the box next to a server name, then click Move up or Move down.
|
|

|
|

|
|

|
Click OK.
|
|
?
|
abcdefgh is the Alias displayed on the DNS page
|
|
?
|
mydomain.com is the Protected Domain
|
|
?
|
CNAME indicates that you are specifying a CNAME record
|
|
?
|
autodomain.mailcontrol.com is the Associated domain displayed with the above alias and protected domain
|
|
The validation performed by clicking Check Status occurs in your local system. Because the propagation of DNS changes across all Internet servers can take between a few minutes to several hours, the verification process for the email hybrid service may take longer.
|
|
mydomain.com. IN MX 5 cust0000-1.in.mailcontrol.com.
|
||
|
mydomain.com. IN MX 5 cust0000-2.in.mailcontrol.com.
|
|
The Check Status button may not appear in the CNAME records area if the hybrid service has already verified domain ownership.
|
|

|
Enable the Email Hybrid Service Log; mark the check box Enable the Email Hybrid Service Log.
|
|

|
From the pull-down menu Retrieve Email Hybrid Service Log data every, specify the time interval for retrieving the most recent Email Hybrid Service Log information, from 15 minutes to 24 hours.
|
|

|
From the pull-down menu Send the Email Hybrid Service Log data to the database every, specify the time interval for sending Email Hybrid Service Log information to the log database, from 15 minutes to 24 hours.
|
|

|
Click OK.
|
|

|
Navigate to the page Settings > General > Subscription.
|
|

|
In the field Subscription key, enter a valid subscription key.
|
|

|
Click OK.
|
|

|
Navigate to the page Settings > General > Data Loss Prevention.
|
|

|
Select the registration method Manual.
|
|
?
|
|
?
|
|
?
|
|

|
Click Register.
|
|

|
|
Wait until DLP policies are completely deployed before you register another standalone appliance.
|
|

|
|
?
|
|
?
|
|
?
|
|

|
Select OK.
|
|
?
|
|

|
From the Security Manager, navigate to the page Settings > Alerts > Alert Events.
|
|

|
From the section Email Alerts, mark the check box Enable email alerts.
|
|
?
|
|

|
Click OK.
|
|

|
From the Security Manager, navigate to the page Settings > Alerts > Alert Events.
|
|

|
In the section SNMP Alerts, mark the check box Enable SNMP alerts.
|
|
?
|
|
?
|
|
?
|
|

|
Click Check Status.
|
|

|
Click OK.
|
|
?
|
|
?
|
|
?
|
|

|
From the Security Manager, navigate to the page Settings > Alerts > Alert Events.
|
|

|
|

|
Click OK.
|
|

|
From Inbound undelivered email event notifications in the list Events, click the link Configure alert thresholds.
|
|

|
|

|
Mark the check box Configure backup destination address to send alerts when the mail server is down.
|
|

|
Click OK.
|
|

|
|

|
From Work queue growth rate notifications in the list Events, click the link Configure alert thresholds.
|
|

|
From the pull-down menu Alert sensitivity level, select the alert sensitivity level, based on how much warning to provide regarding the queue growth rate and the probability of reaching the work queue size limit:
|
|
?
|
High. Work queue capacity reached in less than four days (default).
|
|
?
|
Medium. Work queue capacity reached in less than two days.
|
|
?
|
Low. Work queue capacity reached in less than one day.
|
|

|
Click OK.
|
|

|
|

|
From Exception queue event notifications in the list Events, click the link Configure alert thresholds.
|
|

|
Click OK.
|
|

|
|
?
|
|
?
|
|

|
In the Security Manager, navigate to the page Settings > General > URL Analysis.
|
|

|
From the pull-down menu URL analysis service, select Threat Intelligence Cloud Service.
|
|

|
Verify the connection to the URL analysis service; click Test Connection.
|
|

|
Click the refresh icon.
|
|

|
Click OK.
|
|

|
1. In the Security Manager, navigate to the page Settings > General > URL Analysis.
|
|

|
From the pull-down menu URL analysis service, select Filtering Service.
|
|

|
Verify the connection to the URL analysis service; click Test Connection.
|
|

|
Click OK.
|
|

|
In the Security Manager, navigate to the page Settings > General > URL Analysis.
|
|

|
From the pull-down menu URL analysis service, select Linking Service.
|
|

|
Verify the connection to the URL analysis service; click Test Connection.
|
|

|
Click the refresh icon.
|
|

|
Click OK.
|
|

|
On the page Settings > General > Advanced File Analysis, from the pull-down menu File analysis platform, select a platform: Advanced Malware Detection - Cloud or Advanced Malware Detection - On-Premises).
|
|

|
|

|
Click OK.
|
|

|
|

|
Click OK.
|
|
|
|
|
|