
|

|

|

|
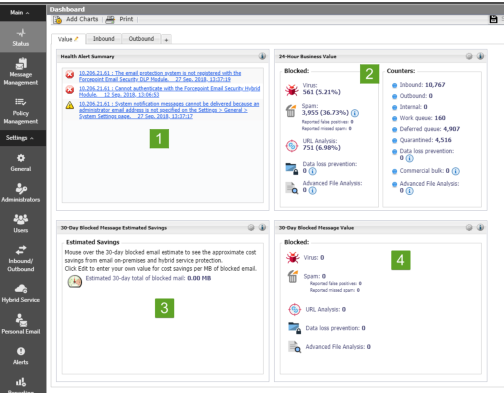
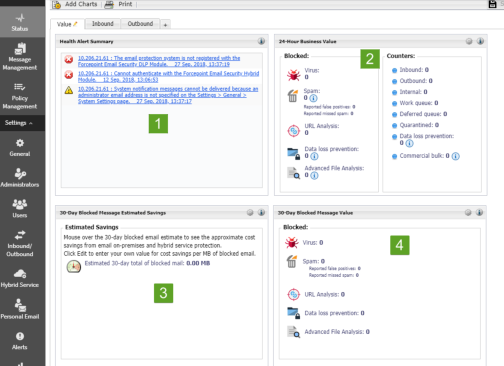
Getting Started > The dashboard > Value dashboard tab
|
|
|
The Health Alert Summary (1) shows the status of your Forcepoint software. Selection of an error or warning alert message to open the Alerts page, where more detailed alert information is available (see Viewing system alerts).
|
|
|
The 24-Hour Business Value chart (2) displays statistics showing how your email security software has protected your network during the past 24 hours by blocking suspicious email traffic. Data includes total numbers of blocked connections and messages listed by analysis result, the numbers of false positive and missed spam results from email analysis, and the number totals for various types of messages handled by the email system.
|
|
|
The 30-Day Blocked Message Estimated Savings chart (3) provides an estimate of savings afforded by your email protection system, which can stop unwanted mail and threats (including at the connection level), protect network resources, and save an organization time and money. With the addition of the Forcepoint Email Security Hybrid Module, infected traffic is stopped before it enters the network, increasing the savings.
|
|
|
The 30-Day Blocked Message Value chart (4) displays metrics similar to the 24-hour value chart demonstrating email system protection for the previous 30 days. This chart illustrates the total numbers and percentages of blocked connections and messages, including false positive and missed spam results from email analysis.
|
|
2.
|
In the field Tab name, enter the new name for the Value tab.
|
|
3.
|
Click OK.
|
|
|
From the dashboard, click Add Charts.
|
|
1.
|
|
2.
|
Click Remove.
|
|
3.
|
Click Remove.
|
|
4.
|
|
|
|
|
|
Getting Started > The dashboard > Value dashboard tab
|