Go to the table of contents Go to the previous page Go to the next page View or print as PDF
Getting Started > The dashboard
The dashboard
Administrator Help | Forcepoint Email Security | Version 8.5.x
The dashboard displays on initial login to the Email Security module of the Forcepoint Security Manager and provides access to charts detailing metrics for the Forcepoint Email Security product.
The dashboard includes three default tabs.
The following image displays the dashboard in version 8.5.3:
The following image displays the dashboard in version 8.5.4:
 
*
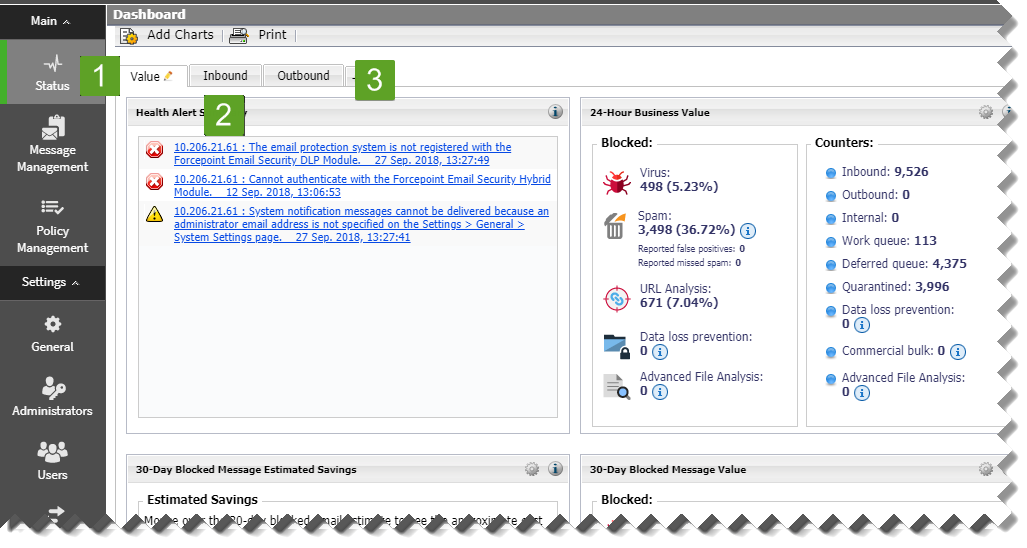
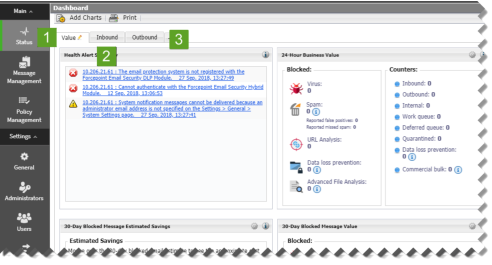
The Value dashboard tab (1) displays on first login and shows information about the value of Forcepoint Email Security in the network, along with a summary of system health alerts.
*
The Inbound dashboard tab (2) shows graphical charts that display top domains and message recipients for inbound email. Top domain and recipient information is sorted by message size or volume.
*
The Outbound dashboard tab (3) shows graphical charts that display top senders for outbound email, sorted by message size or volume. Other default charts for this tab show an overall outbound message summary and a summary of outbound messages that contained embedded URLs.
Dashboard elements are visible to Super Administrators and those delegated administrators with permission to view reports on the email dashboard (see Managing administrator accounts). The type of information and level of detail shown depends on your subscription level. For example, the Forcepoint Email Security Hybrid Module is required to display information about the email hybrid service and how it safeguards your system. Forcepoint Advanced Malware Detection for Email - Cloud must be purchased to view metrics on advanced file analysis functions in the cloud; Forcepoint Advanced Malware Detection for Email - On-Premises must be purchased to view advanced file analysis appliance metrics. The following table details the options available on the dashboard.
 
Adding and configuring dashboard charts
The default Value, Inbound, and Outbound dashboard tabs can each display up to 12 charts at a time. You can customize most dashboard charts to change their time period (for example, today, last 7 days, last 30 days) and their display format (for example, stacked column, stacked area, multi-series line). You can include multiple versions of the same chart on a tab (for example, showing different time periods). See Available dashboard charts for a list of charts for dashboard display.
*
All elements on a tab are also updated when any element on the tab is modified. For example, if the time period for one chart is changed, data is refreshed in all of the charts on the page.
*
*
Add a chart to a dashboard tab
*
The Add Charts window displays. See Adding elements to a dashboard tab.
Move a chart on a dashboard tab
1.
2.
A check mark icon displays when the chart can be placed in a new location.
3.
The chart displays in its new location on the dashboard tab.
4.
The dashboard configuration is saved.
Remove a chart from a dashboard tab
1.
The chart options display.
2.
Click Remove.
The Confirm Remove Chart dialog window displays.
3.
Click Remove.
The chart is removed from the dashboard tab.
4.
The dashboard configuration is saved.
Print a chart
1.
The chart options display.
2.
Click Print.
A new tab displays with a printer-friendly version of the chart.
3.
Click Print.
The chart prints.
Edit a chart
1.
The chart options display.
2.
Click Edit.
The Edit dialog box displays with editing options for the selected chart. Available options depend on the type of chart you selected. Change the following:
*
*
*
*
"Top" numerical designation (e.g., Top N Data Loss Prevention Violations)
*
*
3.
The changes are saved.
4.
The dashboard configuration is saved.
View a larger version of a chart
1.
The Enlarge dialog box displays with an enlarged view of the chart and configuration options.
2.
Example: chart type, time period, top numerical designation.
3.
(Optional) Print the chart; select Print Chart.
4.

Go to the table of contents Go to the previous page Go to the next page View or print as PDF
Getting Started > The dashboard
Copyright 2022 Forcepoint. All rights reserved.