
|

|

|

|
Navigation Tips > Lesson 1: Using the management console
|
|
|
|
||||||
|
|
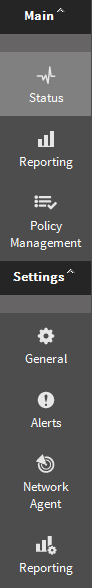
The left navigation pane is used to access status, reporting, and policy management features (under Main), as well as system administration tasks (under Settings).
|
||||||
|
|
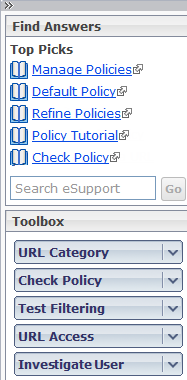
The right shortcut pane is used to find articles, videos, worksheets, and other support information, and to access tools for verifying your configuration.
|
||||||
|
|
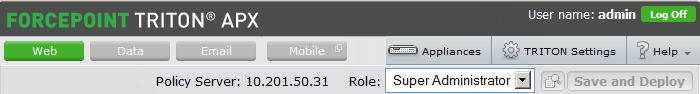
The content pane appears in the center of the TRITON console. The selections that you make in the left navigation pane or right shortcut pane determine what appears in the content pane.
|
|
|
Appliances, used to view a list of appliances in your network.
|
|
|
TRITON Settings, used to perform configuration tasks that affect all of the installed TRITON modules, like creating administrator accounts.
|
|
|
Help, used to access context-sensitive instructions and troubleshooting materials, tutorials, and online Support tools. More information is available in Lesson 2: Accessing Help.
|
|
|
The current Policy Server IP address.
|
|
|
A View Pending Changes button that is enabled when changes have been cached, but not changed.
|
|
|
A Save and Deploy button, whose color indicates whether there are cached changes waiting to be saved
|
|
|
The options under Main provide access to system status information, reporting functions, and policy configuration and management tools. The options are available to all administrative users, but some navigation links are hidden for conditional Super Administrators and delegated administrators.
|
|
|
The options under Settings provide access to account management functions, as well as global and local system administration tasks. The entire Settings group is hidden from some administrators. For others, it offers different options based on the administrator's permissions.
|
|
|
Find Answers provides links to relevant information to help you complete your management tasks.
|
|
|
Top Picks provides links to articles, papers, worksheets, videos, and webinars.
|
|
|
Search lets you locate additional articles, forum posts, videos, and other content on the eSupport website.
|
|
|
The Toolbox contains quick lookup tools that you can use to verify your configuration.
|
|
|
Click URL Category to quickly determine how a URL is categorized.
|
|
|
Click Check Policy to find out which policy is currently being applied to a user.
|
|
|
Click Test Filtering to see how a specific URL is currently being handled (permitted, blocked, etc.) for a user.
|
|
|
Click URL Access to create an investigative report showing whether a site has been accessed from your network within the past 14 days.
|
|
|
Click Investigate User to create an investigative report showing which sites a user has visited in the past 14 days.
|
|
|
|
|
|
Navigation Tips > Lesson 1: Using the management console
|