
|

|

|

|
Presentation Reporting Quick Start : Use templates to create a custom presentation report
|
|
1.
|
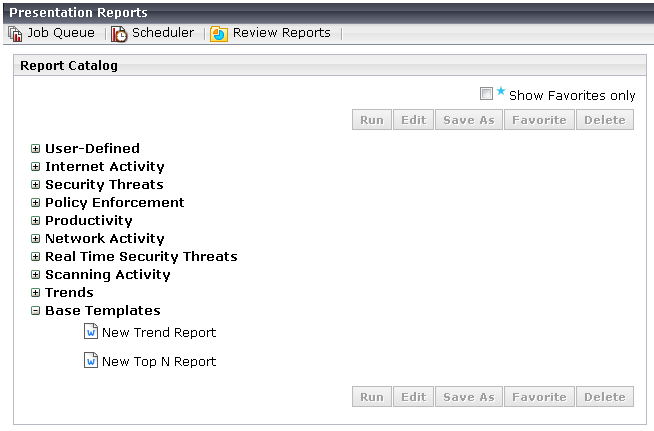
Select a template (New Top N Report or New Trend Report), then click Save As. The Save As New Report window opens.
|
|
2.
|
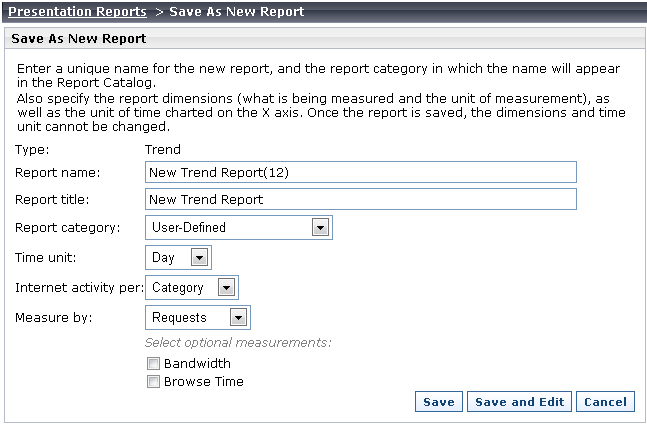
Edit the Report name to make it easier to identify and reuse the report later. This name will be listed in the Report Catalog.
|
|
3.
|
Update the Report title. The title is displayed at the top of the generated report.
|
|
4.
|
Select a Report category to specify where in the Report Catalog the new report will be listed.
|
|
5.
|
If you are creating a trend report, specify the report Time unit (day, week, month, or year). This is the measure of time is to be used to show trending.
|
|
6.
|
Use the Internet activity per drop-down list to select the focal area and main sort criteria of the report. The options are category (default), protocol, risk class, action (like permit or block), user, or group.
|
|
7.
|
Use the Measure by drop-down list to select the main unit of measure to be reported. Select from requests (default), bandwidth, or browse time.
|
|
|
Click Save to save your new report with the default filters and return to the Report Catalog. The new report appears in the report category that you selected.
|
|
|
Click Save and Edit to edit the report filters and further customize your report. Continue with Editing the presentation reports Clients filter.
|
|
|
Click Cancel to exit without saving your report and return to the Report Catalog.
|
|
|
|
|
|
Presentation Reporting Quick Start : Use templates to create a custom presentation report
|