
|

|

|

|
Working with Forcepoint Web Security Cloud > Using cloud portal dashboards
|
|
|
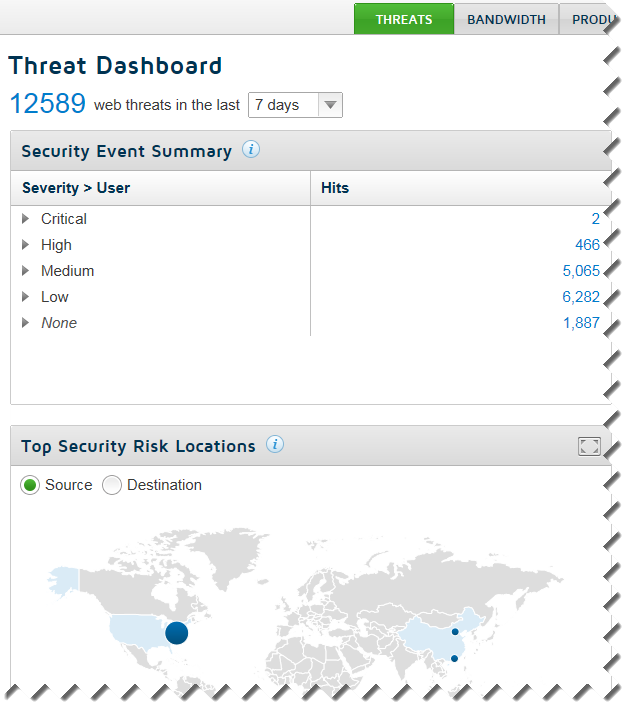
The Threat Dashboard appears when you first access this page. It shows information about suspicious activity that may be related to malware threats in your network.
|
|
|
The Bandwidth Dashboard shows information about traffic patterns in your network, including the categories, groups, and users consuming the most bandwidth.
|
|
|
The Productivity Dashboard shows information about blocked requests, and activity in social media categories.
|
|
|
The Cloud Apps Dashboard shows information about cloud app usage, by category and risk level.
|
|
|
The Data Security Dashboard shows information about data loss and data threat incidents, including a timeline, incidents by content type, and top sources, destinations, and categories associated with incidents. See Configuring Data Security settings.
|
|
|
|
|
|
Working with Forcepoint Web Security Cloud > Using cloud portal dashboards
|