
|

|

|

|
Release Notes for TRITON AP-EMAIL Cloud Reporting : Using the Report Builder
|
|
1.
|
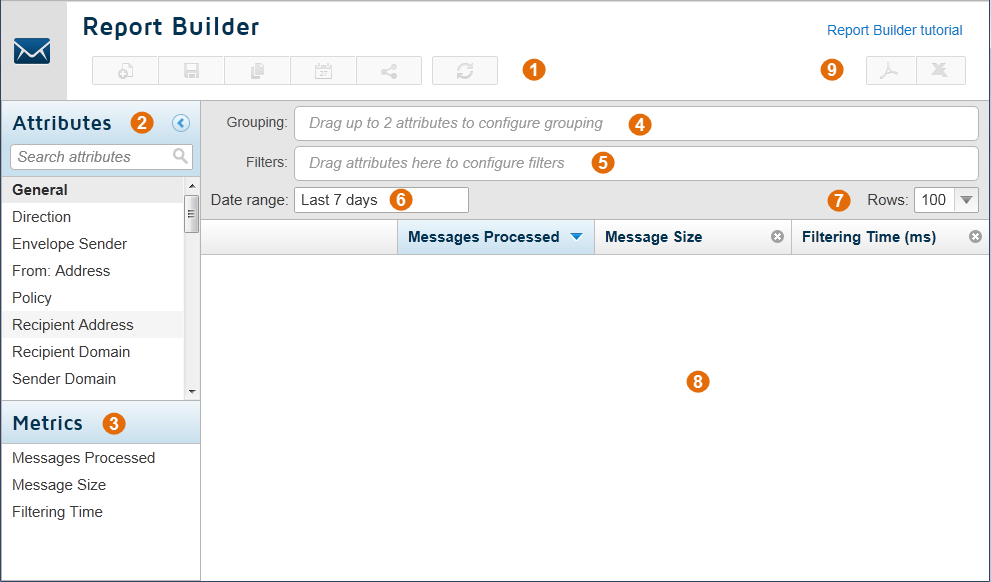
The Toolbar contains buttons for returning to the previous page, starting a new report, and updating the current report.
|
|
2.
|
The Attributes list contains the data types that you can use to create reports. and are divided into the following sections:
|
|
3.
|
The Metrics list contains options that you can add as columns to the report. Drag metrics into and out of the report results area to add them to or remove them from the report. Further advanced metrics are available in the Message Details view.
|
|
4.
|
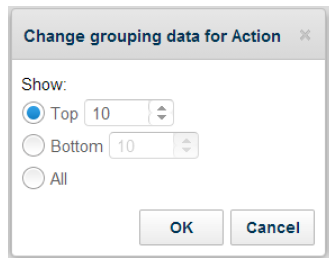
The Grouping field can contain up to 2 attributes to define the data grouping that appears in the report. For example, if you drag the Policy attribute followed by the Recipient Address attribute into this field, this creates a summary report on messages by policy, and also displays the data broken down by recipient addresses within those policies. For more information on defining grouping data, see Creating a report.
|
|
5.
|
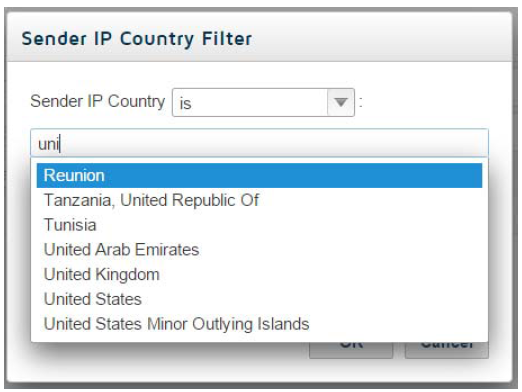
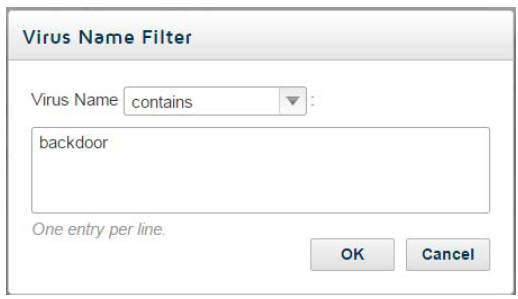
The Filters field can contain attributes to filter the report results further. For example, you may wish to filter by specific senders, actions, or content types. For more information on defining filters, see Creating a report.
|
|
6.
|
The Date range defines the time period covered by the report. This can be a standard period (between 1 hour and 8 months) or a specific date and time range.
|
|
7.
|
The display options enable you to select how many rows appear in your report. Once a report has been generated, this section also includes options to page through longer reports, and to display the report results in different table and graph formats. For more information, see Viewing report results.
|
|
8.
|
The report results appear when you click Update Report, and by default are in a table format. You can choose to display the results in different formats as described above, and to select report elements to drill down further. For more information, see Viewing detailed reports.
|
|
c.
|
Click OK when done.
|
|
|
To specify a set period in hours, days, or months, select an option from the Last drop-down list.
|
|
|
To specify a particular date range, select the From radio button and use the calendars to choose the required dates. Date ranges include the whole 24-hour period, unless you mark Specify start and end time to enable and edit the times for the report as well as the dates.
|
|
|
|
 |
|
 |
|
2.
|
In the popup window, select View Transactions.
|
|
|
Select the columns to display from the Columns drop-down. Click Done when you have made your selections.
|
|
|
Export message details to PDF or CSV format. Either select one or more messages and then click Export to PDF or Export to CSV in the popup window that is displayed, or click the PDF or CSV icon in the top right to export all messages on the page.
|
|
|
|
|
|
Release Notes for TRITON AP-EMAIL Cloud Reporting : Using the Report Builder
|