|

|

|

|
Viewing Incidents and Reports > Data Loss Prevention reports > Incident risk ranking
|
|
|
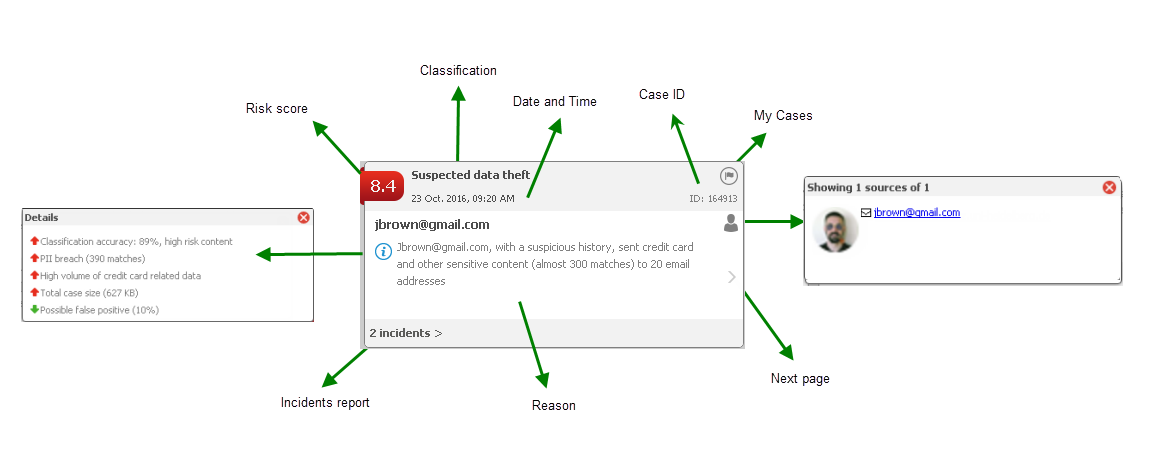
Risk score -
|
|
|
Classification - Cases are classified as one of 2 things:
|
|
|
Suspected data theft - the incidents in this case may indicate an attempt to steal sensitive data. This is based on factors such as statistical information, user and system profiling, the sensitivity of the data, and the risk this incident may impose on the organization.
|
|
|
Uncategorized (unknown) - the incidents in this case do not fall into the Suspected Data Theft classification.
|
|
|
Date & Time - The date and time of the last incident that was added to the case. To see incident risk cases for other dates, use the time line shown above the case cards Click a date to display incidents that occurred on that date. Use the scroll bar to see incidents for the previous week. The time line also shows the number of incidents scoring above the selected threshold each day. The picture below shows that there were 16 incidents above the threshold today (Monday).
|

|
|
Case ID - Each case has a unique ID, such as ID:163840.
|
|
|
My Cases ( ) - Click the flag to add a case to or remove it from a personal case list known as My Cases. When you click the button, the case is added to your list for future reference. You can have up to 200 cases in your My Cases list.
|
|
|
Source - The source that originated the incidents in the case—either a person or machine. Click the person icon to view the LDAP role and picture of the source if available. There can be multiple sources for each case.
|
|
|
Reason - Each case lists reasons why the case is included in the report. For example:
|
|
|
Information () - To view case details, click the information icon on the card. In the example above, there were 390 PII breaches and an unusually high number of credit card incidents. Some descriptions show classification accuracy. Red up arrows indicate that an incident increases a case's risk score. Green down arrows indicate that an incident lowers the risk score.
|
|
|
Next/Previous Page () - Click this button to see the next page of the card for more details. The content varies by case. The second page shows the source and destinations relevant to the case (those that pose a risk) and any files that are involved.
|
|
|
Number of incidents - The number of incidents in the case are shown as a link on the bottom of the card. Click this link to drill down to the current Incidents report, filtered according to the case, so you can investigate the incidents further.
|
|
|
My Cases - Shows the cases that you have flagged.
|
|
|
Settings - Opens the Settings > General > Reporting page where you can configure reporting preferences such as risk score threshold—e.g., show only cases exceeding a score of 8.0.
|
|
|
Export to PDF- Exports all the cases that are currently displayed to PDF.
|
|
|
|
|
|
Viewing Incidents and Reports > Data Loss Prevention reports > Incident risk ranking
|