Go to the table of contents Go to the previous page Go to the next page View or print as PDF
New in TRITON AP-DATA v8.2.5
Updated: 22-Aug-2016
Version 8.2.5 of Forcepoint TRITON AP-DATA is a major release that offers several new features, including:
*
*
*
*
*
*
*
TRITON AP-DATA
Incident risk ranking
New in this release, TRITON AP-DATA includes a new advanced security analytics capability called incident risk ranking. It uses statistical data modeling and behavioral baselines to automatically identify and rank groups of high-risk incidents.
A new DLP component, the analytics engine, consumes incidents generated by DLP policies across all core TRITON AP-DATA components and reports on those with the highest data loss or data theft risk score. You can use this information to identify the highest risks to your organization so that you can take remediation action and prevent future risks.
No additional license is required to benefit from this new analytics capability. To use this feature, you must first install an analytics engine on a 64-bit Linux machine. For instructions, refer to the TRITON AP-DATA Installation Guide.
Incident risk ranking is the first application of the analytics engine, with additional use cases planned for future AP-DATA releases.
This feature includes the following:
New Incident Risk Ranking report
Main > Reporting > Data Loss Prevention > Report Catalog > Security Analytics > Incident Risk Ranking
This new report shows up to 20 cases with the highest risk scores during the selected time period, along with details for those cases. Cases are groups of related incidents that, combined, indicate a risk to your organization—for example, incidents of data being sent to suspicious destinations or those occurring outside normal office hours. Cases are represented by cards such as this:
Incidents within cases are also ranked according to their number of matches, transaction size, content, breached policies and rules, date and time, and more.
Cards show the following information:
*
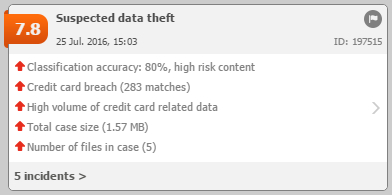
Risk score - The risk score assigned to the case, between 0-10 with 10 being the highest risk. This score is derived by the analytics engine and can be used to assess the security risks in your organization. Scores are based on data accumulated over time. An incident with a score of 2.5 may not pose a high-risk on Monday, but when combined with other incidents from the same source over the week, it might be assigned a higher score.
*
Classification - Cases are classified as one of 2 things:
*
Suspected data theft - the incidents in this case may indicate an attempt to steal sensitive data. This is based on factors such as statistical information, user and system profiling, the sensitivity of the data, and the risk this incident may impose on the organization.
*
Uncategorized (unknown) - the incidents in this case do not fall into the Suspected Data Theft classification.
*
Reasons - Each case lists reasons why the case is included in the report. For example, in the case above, there was a data theft breach and a large number of files. Some descriptions show classification accuracy. Red up arrows indicate that an incident increases a case's risk score. Green down arrows indicate that an incident lowers the risk score.
*
Case ID - Each case has a unique ID, such as ID:163840.
*
Date & Time - The date and time of the last incident that was added to the case. To see incident risk cases for other dates, use the time line shown above the case cards Click a date to display incidents that occurred on that date. Use the scroll bar to see incidents for the previous week. The time line also shows the number of incidents scoring above the selected threshold each day.
*
Next/Previous Page () - Click this button to see the next page of the card for more details. The content varies by case. The second page shows the source and destinations relevant to the case (those that pose a risk) and any files that are involved.
*
Number of incidents - The number of incidents in the case are shown as a link. Click this link to drill down to the current Incidents report, filtered according to the case, so you can investigate the incidents further.
New dashboard elements
Main > Status > Dashboard > Data Loss Prevention Incidents - Top Incident Risks
Once you have installed and registered the analytics engine, you can see the top cases for the previous day (midnight to midnight) and the last 7 days from the TRITON AP-DATA dashboard. These charts display the number of cases during the designated period with scores above your threshold. You specify which scores to display under Settings > General > Reporting. Click the chart to view details on each case.
New report settings options
Settings > General > Reporting > General tab > Incident Risk Ranking
In report settings, you set your threshold for defining incident risk cases. Risk cases with scores above this number appear on the Dashboard and in the Incident Risk Ranking report.
For example, if you want to see only the most severe risks, select 8.0-10. Cases assigned a risk score above 8 will be shown.
On this screen, you can also select your organization's normal work week, Monday - Friday by default. This shows on the Incident Risk Ranking report date filter.
New System Module
Settings > Deployment > System Modules
If you install the analytics engine, a new module appears in the System Modules list. This lets you monitor the status of the module and modify general attributes such as its name and description.
New System Health charts
Main > Status > System Health
Once the analytics engine is installed, you can monitor its health on the System Health page. There you can view a system summary, CPU usage, memory usage for the machine.
Email Gateway for Office 365 Azure Marketplace deployment
In this release, the TRITON AP-DATA Email Gateway for Microsoft Office 365 image is available in the Azure Marketplace. Although a manual download is still available on the Forcepoint website, you can streamline your Azure deployment by accessing it in the Marketplace.
Log onto the Azure portal, https://portal.azure.com/, select Browse, and then click Marketplace. Search for and select TRITON AP-DATA Email Gateway.
 
In previous releases, you managed the virtual appliance in Azure Classic mode. You can now manage it using Azure Resource Manager.
For instructions on deploying the Email Gateway VM, refer to the TRITON AP-DATA Installation Guide.
CentOS 7 support for protector/mobile agent
To take advantage of the latest Linux features, the protector and mobile agent include CentOS 7 starting with v8.2.5. Because earlier versions use CentOS 5, you must install the protector from scratch if you wish to use the new CentOS 7 version.
Management configuration, such as policy and agent settings, are recovered when you deploy the new module; however, local customizations made on the protector/mobile agent machine are not.
The protector and mobile agent are forward compatible, so you can retain your existing installation and still take advantage of v8.2.5 management, analytics, and endpoint features.
Support for USB protector/mobile agent installation
Starting with v8.2.5, you can install the protector image from a bootable USB drive as well as a CD/DVD. Just burn the ISO image file to the USB and run the protector wizard as you would normally.
TRITON AP-ENDPOINT DLP
Support for XenApp environments
TRITON AP-ENDPOINT DLP can now be deployed on Citrix XenApp servers to provide data loss and data theft prevention on virtual clients.
Version 8.2.5 of TRITON AP-ENDPOINT DLP supports the following versions of Citrix XenApp:
*
*
*
In the XenApp environment, TRITON AP-ENDPOINT DLP supports the following destination channels:
*
HTTP/S - analyzes data being posted to the Web via Internet Explorer, Edge, Chrome, or Firefox browsers.
*
Email - analyzes email messages sent from endpoint users, even if they send them to external Web mail services such as Yahoo.
*
Print - monitors data being sent from an endpoint machine to a local or network printer. The system supports drivers that print to a physical device, not those that print to file or PDF.
*
Application file access - monitors access to files in supported applications. Cloud are supported if accessed through Firefox.
For more information, see "Deploying TRITON AP-ENDPOINT DLP on Citrix XenApp clients."
 

Go to the table of contents Go to the previous page Go to the next page View or print as PDF
Copyright 2016 Forcepoint LLC. All rights reserved.