
|

|

|

|
Presentation Reporting Quick Start : Example 1: A custom report based on an existing report
|
|
1.
|
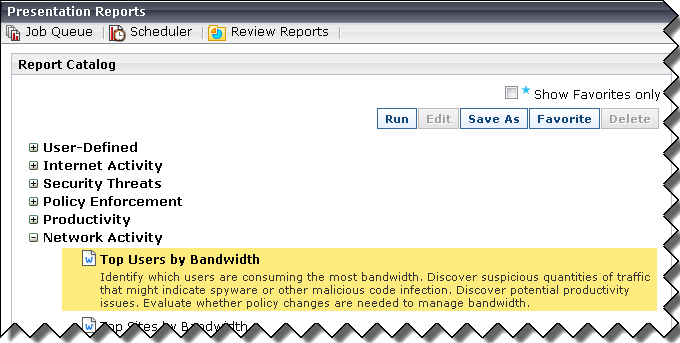
To start, find an existing report in the Report Catalog that includes bandwidth information by user, like Network Activity > Top Users by Bandwidth, and select it.
|
|
2.
|
|
3.
|
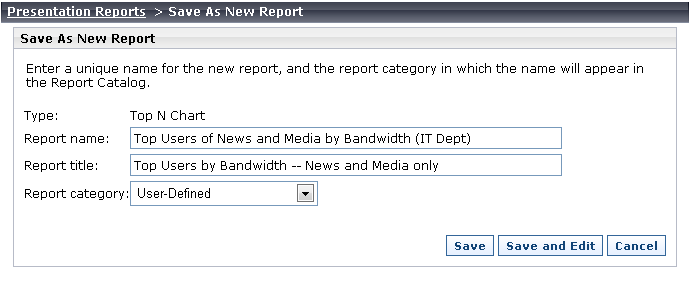
Click Save and Edit to open the Edit Report Filter window.
|
|
4.
|
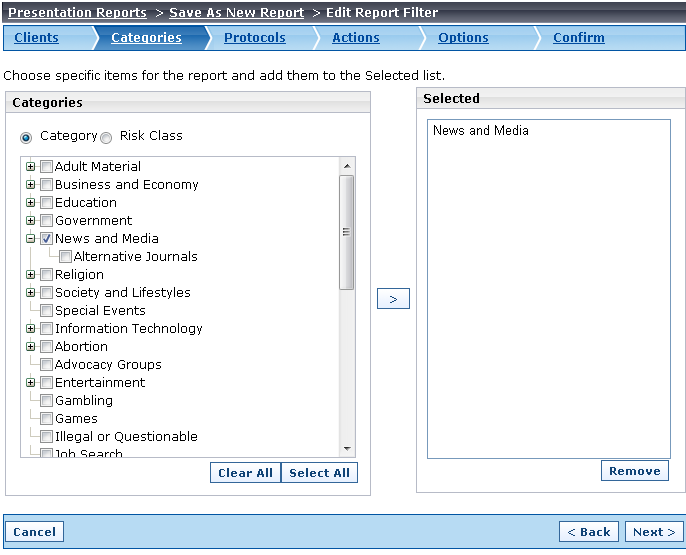
To include all clients in the report, click Next on the Clients tab without making any changes.
|
|
5.
|
On the Categories tab, mark the check box next to News and Media, then use the right-arrow (">") button to move the category to the Selected list.
|
|
6.
|
Because that's the only category you want to select, and there are no changes to make to the Protocols or Actions filters, click Options in the navigation bar at the top of the page.
|
|
7.
|
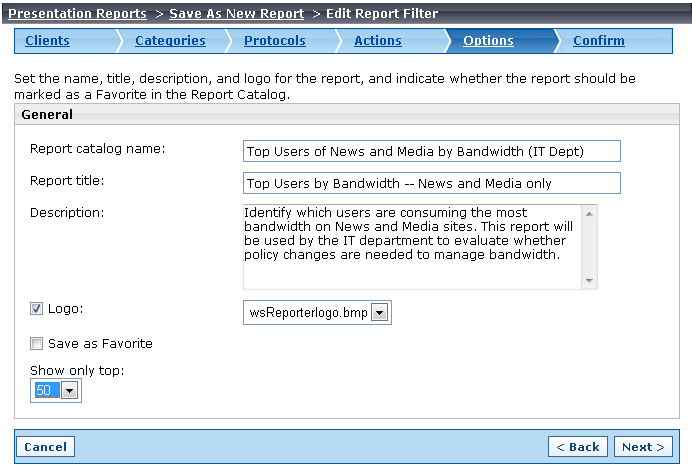
Verify the information that appears on the Options page, and update the Description to more accurately describe the new report.
|
|
8.
|
For purposes of this example, select 50 as the Show only top value. The report will include only the top 50 clients that used the most bandwidth browsing to News and Media sites.
|
|
9.
|
|
10.
|
To run the report and make sure it provides the information you want, select Save and run, then click Finish.
|
|
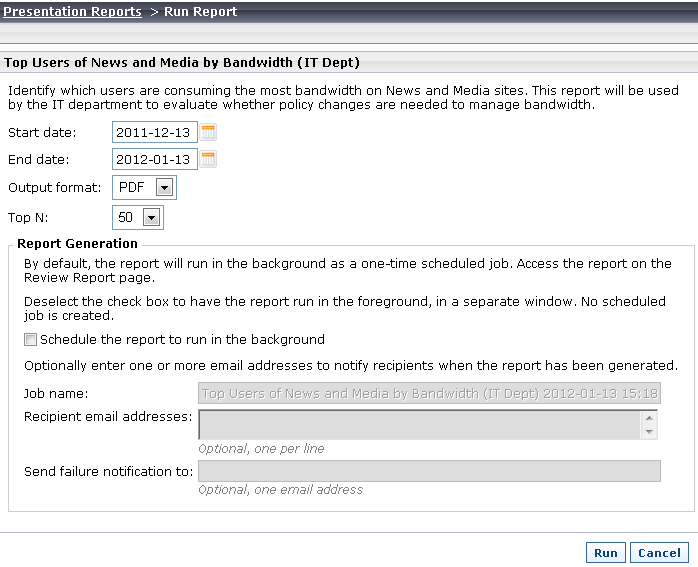
1.
|
The Run Report window opens with today's date as the Start date and End date. Change the Start date to get a better idea of how much bandwidth has been used over time. (You can run the report again later with a different date range if needed.)
|
|
2.
|
If you have Acrobat Reader on your computer, don't change the default Output format. Otherwise, select an output format that you can use.
|
|
3.
|
The Top N value is taken from your report definition and can be changed each time the report is run.
|
|
4.
|
If you have Acrobat Reader installed, to more quickly verify that the report meets your needs, clear the Schedule the report to run in the background check box and click Run.
|
|
|
|
|
|
Presentation Reporting Quick Start : Example 1: A custom report based on an existing report
|