
|

|

|

|
Presentation Reporting Quick Start : Example 2: A custom report based on a template
|
|
1.
|
|
2.
|
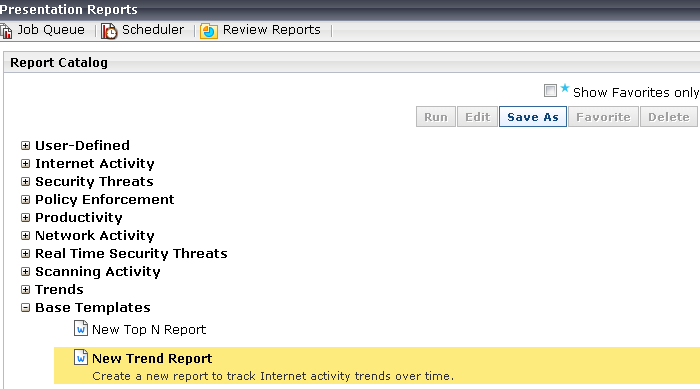
Click Save As to open the Save As New Report window.
|
|
3.
|
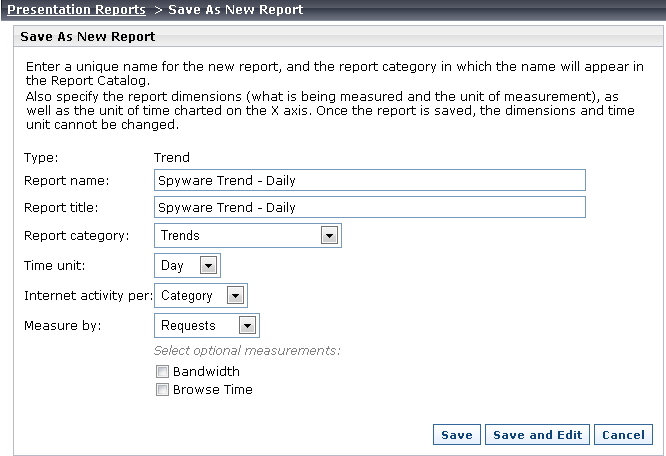
Edit the Report name and Report title to provide information about the report contents, then select a Report category that will allow you to easily find the report later. For this example, we'll select Trends.
|
|
4.
|
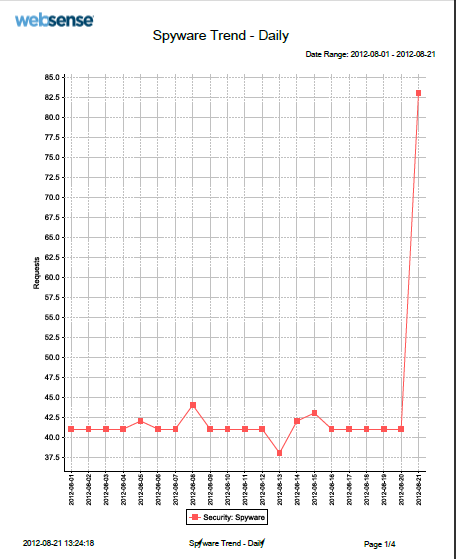
Because this report will compare daily requests for Spyware sites, select Day as the Time unit, Category for Internet activity per, and Requests from the Measure by list.
|
|
5.
|
Click Save and Edit to open the Edit Report Filter window.
|
|
6.
|
|
7.
|
Scroll down to Security and mark the check box next to Spyware. Use the right-arrow (">") button to move the category to the Selected list.
|
|
8.
|
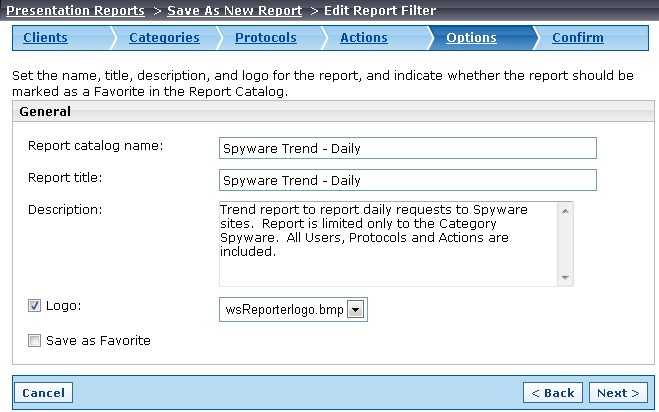
There are no changes needed for Protocols or Actions, so click Options in the navigation bar to move to the Options tab.
|
|
9.
|
Verify the Report catalog name and Report title, then edit the Description to provide more accurate information about the report contents.
|
|
10.
|
|
11.
|
|
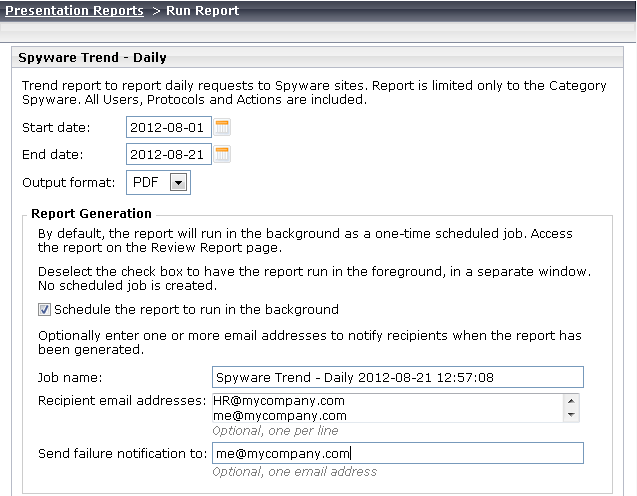
1.
|
The Start date and End date are set to today's date so, since you wanted to look at trend for the current month, set the Start date to the first day of the month.
|
|
2.
|
If you have Acrobat Reader installed, don't change the Output format. Otherwise, select a format you can use. (PDF is best suited for creating a readable Trend report.)
|
|
3.
|
Select Schedule the report to run in the background and enter your email address in the Recipient email addresses field.
|
|
4.
|
Also enter your email address in the Send failure notification to field to receive a message if the report can't run.
|
|
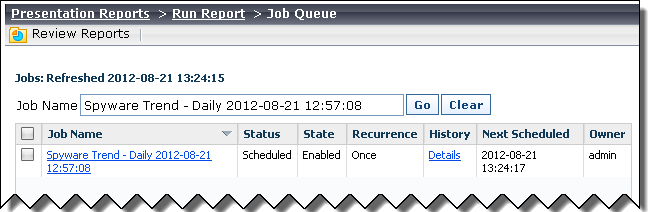
5.
|
Click Run. The Job Queue window opens, showing the scheduled job for your new report.
|
|
|
|
|
|
Presentation Reporting Quick Start : Example 2: A custom report based on a template
|