Go to the table of contents Go to the previous page Go to the next page View or print as PDF
Presentation Reporting Quick Start
Topic 50430 | Presentation Reporting Quick Start | Websense Web Security Solutions | Updated 19-Sep-2013
Use presentation reports to create bar charts, trend charts, or tabular reports showing Internet activity in HTML, PDF, or Microsoft Excel (XLS) format.
Presentation reports may be used:
*
A presentation report is often available that provides additional detailed information that can be used for comparisons over a longer time period, across more users, including more categories, and so on.
*
The available presentation report formats may be more readable or usable to some consumers than the available investigative reports formats.
Find presentation reports and templates on the Reporting > Presentation Reports page in TRITON - Web Security. When the page opens, the Report Catalog displays a list of report categories.
Expand a category to see the predefined and custom reports it contains.
Note that your subscription determines what appears in the catalog. For example, Real Time Security Threats require a Websense Web Security Gateway or Gateway Anywhere subscription
From the initial Presentation Reports page you can:
*
*
To customize the new report, see:
*
*
*
*
*
*
For some examples of what kinds of custom reports you might create, see:
*
*
*
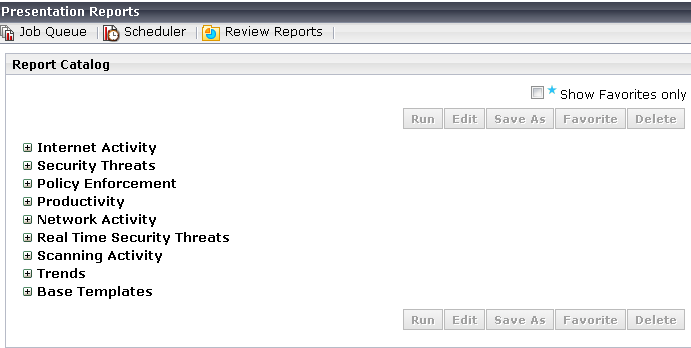
Create Favorite presentation reports to make it easy to find and schedule frequently-used reports.
*
*
Use Review Reports to view scheduled presentation reports. The page lists generated reports that have not yet been deleted.
For a list of reports, with a brief description of each, see What information do the predefined presentation reports include?.

Go to the table of contents Go to the previous page Go to the next page View or print as PDF
Presentation Reporting Quick Start
Copyright 2016 Forcepoint LLC. All rights reserved.