
|

|

|

|
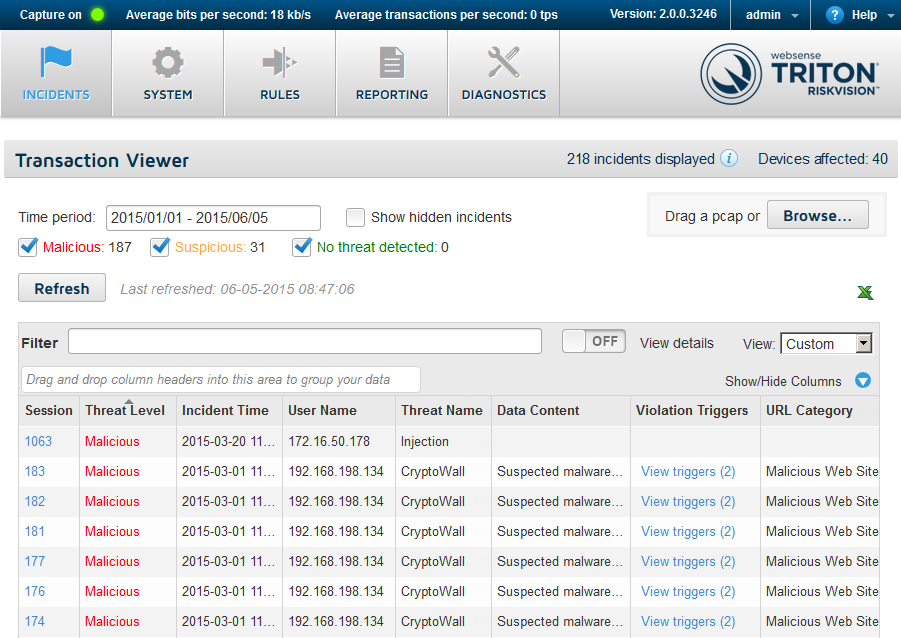
Working with RiskVision Incidents
|
|
|
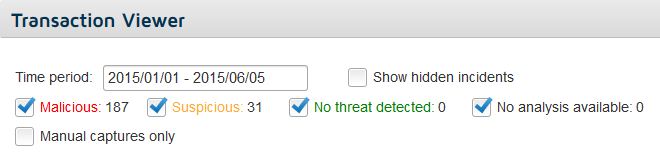
Specify the Time period to display. The default value reflects the time span between the oldest incident in the database (by incident time) and the current day.
|
|
|
Indicate whether you want to show Manual captures only.
|
|
|
Specify whether or not to Show hidden incidents. Incidents created based on cloud app data that have no other threat or data loss characteristics are hidden by default.
|
|
|
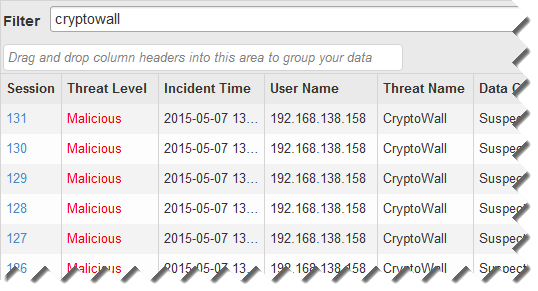
Enter a string (like a threat name, user name, or IP address) in the Filter field to show only incidents that contain that string.
|
|
|
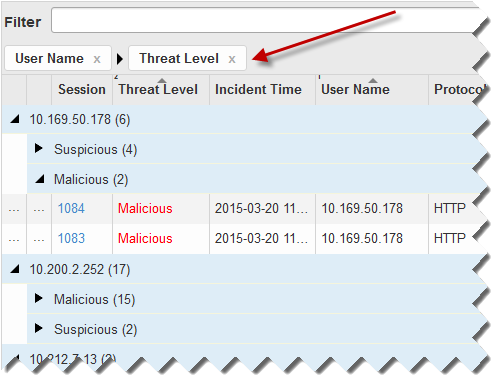
Group the data in the table by one or more fields (for example, source IP and threat name, and shown below). To do this, click on a column header (like User Name) and drag it straight up into the sorting row above the table. Repeat for each additional field that you'd like to use to group the data.
|
|
|
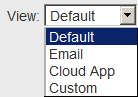
Use the View drop-down list to select a predefined set of columns to show in the table. The default view emphasizes threat and data loss information for HTTP transactions.
|
|
|
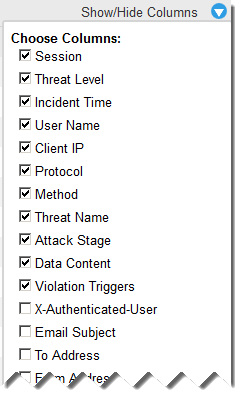
Use the Show/Hide Columns drop-down list to customize which columns appear in the table.
|
|
|
|
|
|
Working with RiskVision Incidents
|