
|

|

|

|
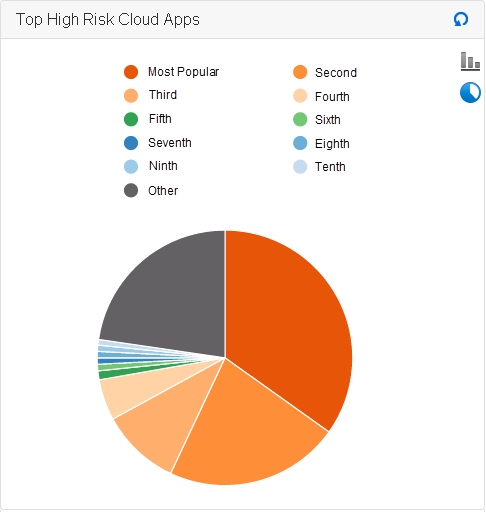
Using RiskVision to Investigate Cloud App Use : Which high-risk cloud apps are being accessed most frequently in my network?
|
|
1.
|
Navigate to the Reporting > Executive Reports tab.
|
|
2.
|
|
3.
|
|
4.
|
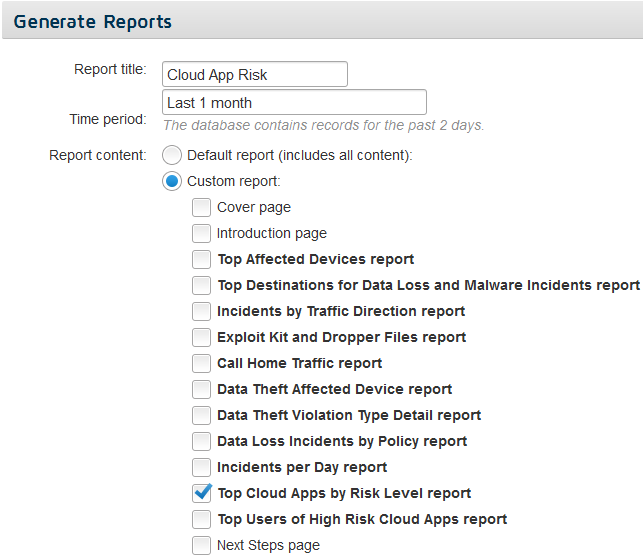
Indicate how many records to include via the Top N number field (10, by default), then select a Report format.
|
|
|
Version 2.1: Mark the check box next to Show hidden incidents.
|
|
|
Version 2.0: Clear the check box next to Hide suppressed incidents.
|
|
6.
|
Click Run Report Now.
|
|
7.
|
|
|
|
|
|
Using RiskVision to Investigate Cloud App Use : Which high-risk cloud apps are being accessed most frequently in my network?
|