
|

|

|

|
Viewing Status > Viewing the Dashboard
|
|
|
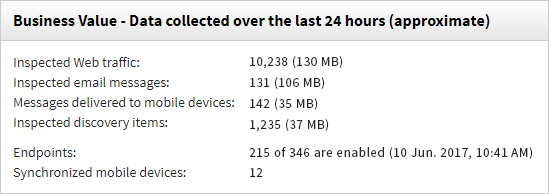
Inspected Web traffic shows the number of web transactions (including posts) analyzed, and the cumulative volume of the traffic in megabytes.
|
|
|
Inspected email messages shows the number of email messages analyzed, and the cumulative size of the messages in megabytes.
|
|
|
Inspected mobile device messages shows the number of email messages that were analyzed when being sent to mobile devices from network Exchange servers, and the cumulative size of the messages in megabytes.
|
|
|
Discovery inspected items shows the number of files plus the number of database chunks scanned using network discovery, and the cumulative size of these items in megabytes. (A database chunk is approximately 5000 records.)
|
|
|
Connected endpoints shows the number of endpoint clients connected to the system.
|
|
|
Synchronized mobile devices shows the number of mobile devices that have synchronized with the mobile agent in the last 24 hours (may be fewer than the number of registered devices).
|
|
|
Incident Risk Ranking - Top Cases shows any cases found in the network with risk scores that exceed a configurable threshold.
|
|
|
The displays uses the risk threshold set on the Settings > General > Reporting > Incident Risk Ranking tab.
|
|
|
Incident Risk Ranking - Top Cases (last 7 days) displays the number of cases above the risk threshold detected during each of the last 7 days. The height of the bars and the value shown inside represent the number of the risky cases for each date.
|
|
|
Incidents by Severity displays the number of incidents that have entered the system in the last 24 hours by severity. These include all incidents that the system has detected.
|
|
|
Top 5 Policies displays the policies that had the most incident violations, and the number of incidents in each of these policy categories.
|
|
|
Top 5 Hosts displays the top 5 violating hosts and the number of incidents detected on these hosts broken into categories of urgency. (See above.)
|
|
|
Top 5 Policies: displays the top 5 policy categories that were violated, and the number of incidents discovered for these policy categories.
|
|
|
|
|
|
Viewing Status > Viewing the Dashboard
|