Go to the table of contents Go to the previous page Go to the next page View or print as PDF
Incident risk ranking
Administrator Help | Forcepoint DLP | Version 8.4.x
Cases are groups of related incidents that combined, indicate a risk to the organization—for example, incidents of data being sent to suspicious destinations or incidents occurring outside normal office hours.
Cases are assigned risk scores by a sophisticated, Linux-based analytics engine. (See the Forcepoint DLP Installation Guide for details.)
*
*
*
For information on the analytical and statistical techniques used to rank and score incidents, see Risk-Based DLP Incident Ranking.
The Incident Risk Ranking report shows the cases with the highest risk scores during the specified time period, along with details for those cases. Specify the threshold for displaying cases on the Settings > General > Reporting > Incident Risk Ranking page in the Data Security module of the Security Manager. Up to 20 cases are shown. (See Setting reporting preferences.)
Only administrators with Summary reports permissions can view Incident Risk Ranking reports.
In Incident Risk Ranking reports, each case is represented by a card:
Cards show the following information:
*
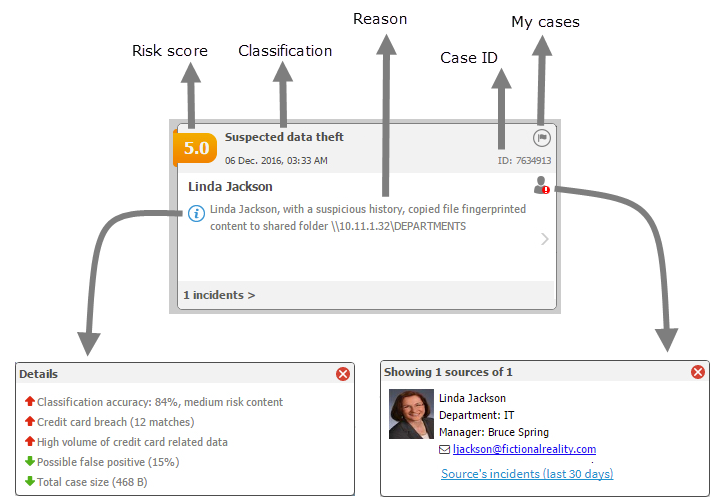
The Risk score assigned to the case, between 0 (lowest risk) and 10 (highest risk).
This score is derived by the analytics engine and can be used to assess the security risks in your organization. Scores are based on data accumulated over time. An incident with a score of 2.5 may not pose a high-risk on Monday, but when combined with other incidents from the same source over the week, it might be assigned a higher score. The sample case shows a risk score of 5.0.
See What factors affect risk scoring? for more information about factors that influence the risk score.
*
The Classification is one of the following:
*
Suspected data theft - the incidents in this case may indicate an attempt to steal sensitive data. This is based on factors and indicators such as behavioral anomalies, user and system profiling, the sensitivity of the data, and the destination of the transaction.
*
Possibly broken business process - the incidents in this case may be the result of business process deficiencies. For example, if unsecured sensitive content is sent daily from several users to a business partner, the users are probably not aware that they are doing something wrong. This classification is based on factors such as recurring patterns that could indicate common behavior.
*
Uncategorized (unknown) - the incidents in this case do not fall into another classification.
*
The date and time the case was opened is displayed under the classification. To see incident risk cases for other dates, use the time line shown above the case cards Click a date to display incidents that occurred on that date. Use the scroll bar to see incidents for the previous week. The time line also shows the number of incidents scoring above the selected threshold each day. The picture below shows that there were 16 incidents above the threshold today (Monday).
*
The case ID is a unique numeric identifier.
*
Click the My Cases flag ( ) to add a case to, or remove a case from, a personal case list.
Each administrator can have up to 200 cases in his or her My Cases list.
*
The source that originated the incidents in the case: a person or machine and the LDAP role, if available.
*
*
*
In the source pop-up window, click the Source's incidents... quick link to open a report showing incidents associated with the selected source over the last 30 days.
*
The reason the case is included in the report. For example:
jbrown@gmail.com sent credit card and other sensitive content (almost 300 matches) to 3 common email addresses.
*
To view case details, click the information () icon on the card.
Some detail descriptions show classification accuracy. Red up arrows flag indicators that increase a case's risk score. Green down arrows flag indicators that lower the risk score.
*
The content varies by case. The second page shows the source and destinations relevant to the case (those that pose a risk) and any files that are involved.
*
The number of incidents in the case are shown as a link on the bottom of the card.
Click this link to drill down to the current Incidents report, filtered according to the case, so you can investigate the incidents further. Under the link is a date range showing when the incidents occurred.
Toolbar
The toolbar at the top of the report offers access to the following additional features and functions:
*
My Cases shows the cases that you (the currently logged-on administrator) have flagged.
*
Settings opens the Settings > General > Reporting page, used to configure reporting preferences such as risk score threshold—for example, show only cases exceeding a score of 8.0.
*
Export to PDF exports all of the cases that are currently displayed to PDF.

Go to the table of contents Go to the previous page Go to the next page View or print as PDF
Copyright 2017 Forcepoint. All rights reserved.